Electric Submersible Pump design for oil & gas
ESP Design Platform
A web platform for designing Electric Submersible Pump (ESP) installations in oil wells: from a 3D wellbore trajectory to pump, motor, and cable selection, in one seven-step engineering workflow with layered validation and print-ready reports.
- Role
- Frontend Engineer · Freelance
- Year
- 2026
- Type
- Client project
Team project. I worked on the Next.js frontend; the FastAPI backend was built by another team. The 3D viewer was co-built with a teammate. All data shown in the covers is demo data.
Client work under NDA: source code and live app are not publicly available.
7
Workflow steps
5
Validation layers
9
Equipment catalogs
~1,100
TypeScript files
~104k
Lines of code
780+
Commits
Problem
Choosing the right ESP means a long chain of dependent calculations: well geometry → fluid properties → reservoir inflow → required head → only then pump, motor, cable, and surface equipment. It usually lives in spreadsheets or expensive desktop software, scattered and hard to audit, and one wrong number early on ripples all the way to the equipment that gets ordered.
Solution
A frontend that guides engineers through the chain step by step, validates every input against physical and engineering rules, visualizes the well in 3D, warns when an upstream change invalidates selected equipment, and turns the result into equipment recommendations and print-ready reports.
Problems Solved
ESP design done in separate spreadsheets or licensed desktop tools, with no single flow or version trail
→One guided web workflow where each step unlocks only after the previous one is valid
Input errors surface at the end of the process, far from where they were made
→Per-field save on blur with server errors mapped back to the exact field
Changing one input (e.g. water cut) can silently invalidate a pump that was already selected
→A cross-step guard that checks impact after saves and cascades the release of invalid equipment
Pumps set in a dogleg fail early, and pressure math uses TVD, not MD
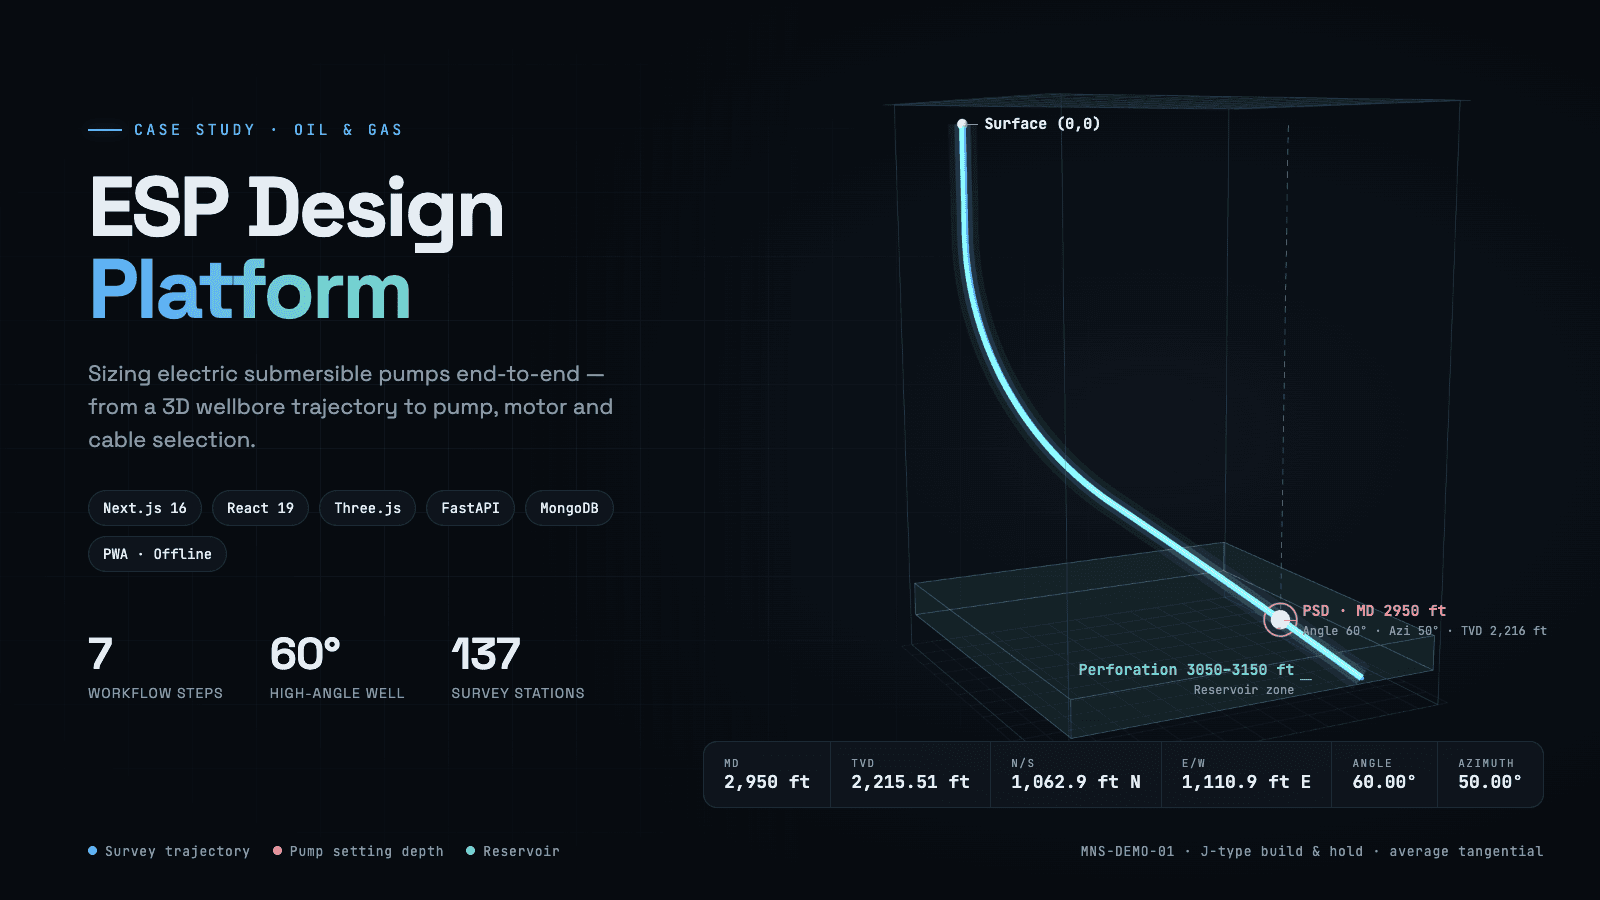
→An interactive 3D trajectory viewer showing exactly where the pump sits on the well path
Results must reach clients and field teams as formal documents
→Compact, Detail, and Attachment reports on A4 pages with engineer-chosen chart and 3D snapshots
Field sites with unstable connectivity
→PWA with workflow queries persisted to IndexedDB and an offline mutation queue
Key Features
Seven-Step Workflow
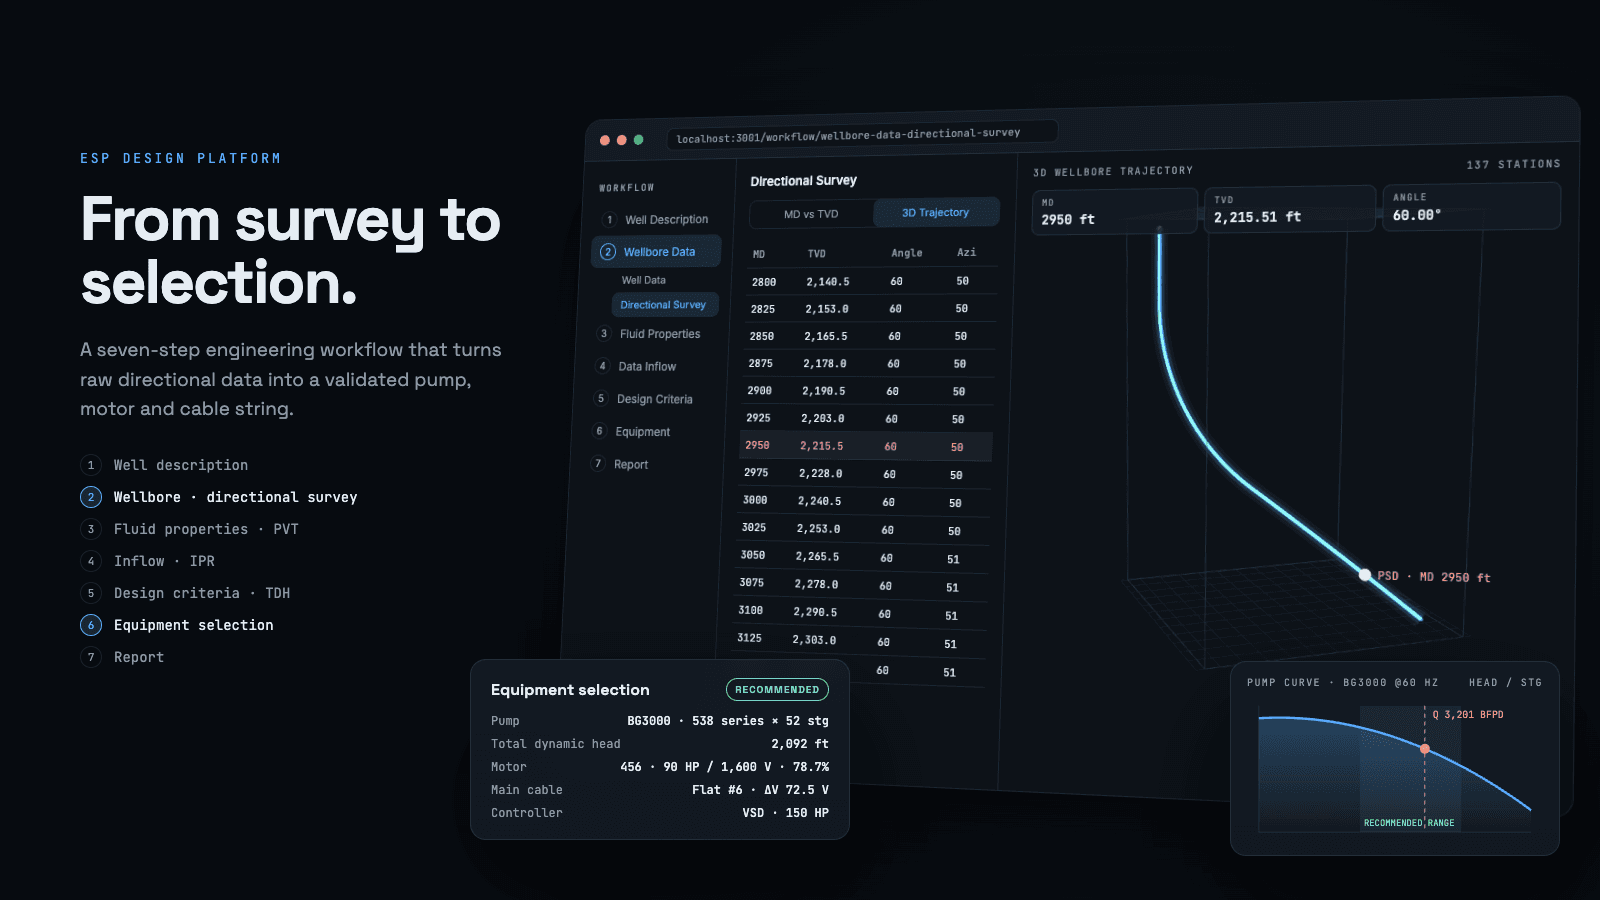
- Well Description → Wellbore Data → Fluid Properties → Data Inflow → Design Criteria → Equipment Selection → Report
- Directional survey step appears only for non-vertical wells
- Next is enabled only when the backend reports the step as complete (can_continue)
- Role-based landing: engineers go straight to the workflow, admins to the dashboard
Wellbore & Trajectory
- Spreadsheet-style survey grid: keyboard navigation, paste from Excel from the active cell, copy back, unit conversion
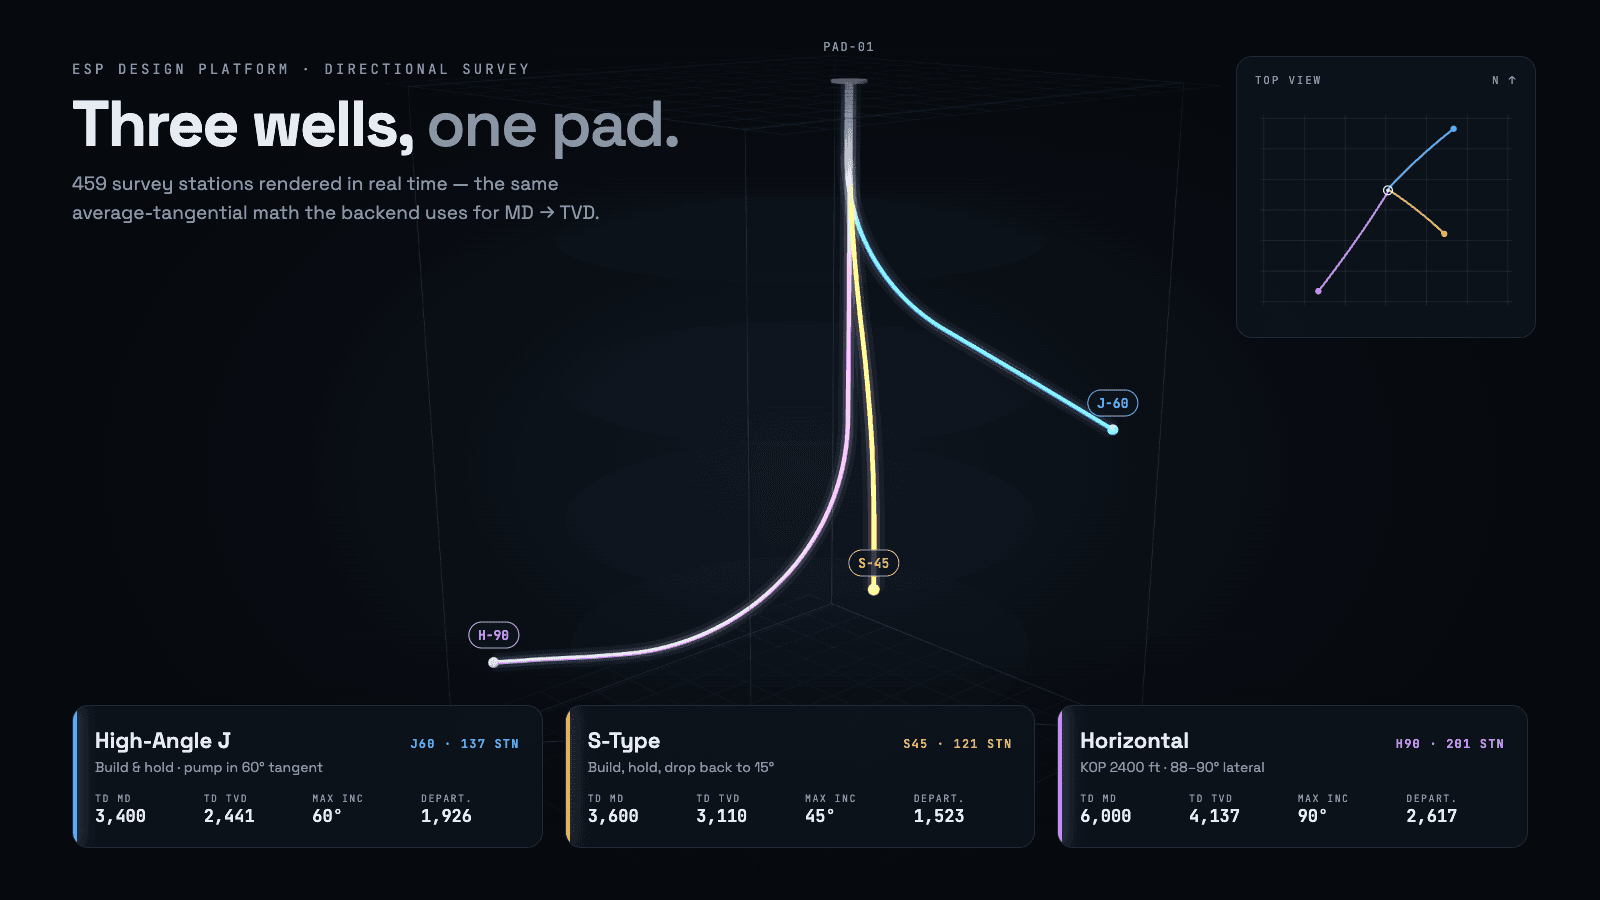
- Four 2D views (MD vs TVD, MD vs Angle, top view, isometric) plus one 3D view
- KPI strip with MD, TVD, N/S, E/W, angle, and azimuth at pump depth
Engineering Calculations
- PVT curves, viscosity, and water cut from fluid properties
- IPR curves with PI, Vogel, and Composite models; productivity index and Qmax
- Total Dynamic Head, GVF, and performance curves from design criteria
- Unit switching (ft/m, psi/bar, bbl/d/m³/d) with canonical values stored on the server
Equipment Selection
- Pump → intake → protector → motor → cable & MLE → wellhead → controller → transformer
- Tiered status per item: recommended, preferred, acceptable, warning, fail
- Summary panel with design recommendation vs actual selection and specific checks (thrust, casing clearance, shaft HP, ampacity)
- Surface cable shown per segment: wellhead → junction box → switchboard/VSD → transformer
Master Data
- Catalogs for pumps, motors, protectors, intakes, cables, MLE, wellheads, controllers, transformers, casing and tubing
- Paginated tables with search, status toggle, and Excel import with templates
- Pump curve form from tabulated points: paste from Excel, monotonic rate validation, up to 30 points
Reports
- Compact, Detail, and Attachment reports on responsive A4 pages with @page portrait/landscape
- Well schematic and equipment callouts drawn as SVG
- Snapshots taken from the exact same chart components as the workflow
System Design & Architecture
Next.js 16 App Router with a strict three-layer data flow: services → hooks → components. Components never call the API directly; every endpoint has its own service file wrapped by a TanStack Query hook. A central fetchData() attaches the token and device ID and handles 401 → refresh → retry once → logout behind a single-flight guard. Server state lives in TanStack Query (workflow queries persisted to IndexedDB), design context and per-step errors in Zustand with versioned migrations, and offline sessions and the mutation queue in Dexie. The UI follows Atomic Design, with React Compiler enabled.
UI (Atomic Design)
- atoms → molecules → organisms → pages
- Workflow canvas with step routing from the pathname
Data layer
- Services per endpoint + TanStack Query hooks
- fetchData(): token, X-Device-Id, single-flight refresh
Client state
- Zustand: active well, espDesignId, per-step errors
- IndexedDB: persisted queries, Dexie offline queue
External
- FastAPI backend (built by another team)
- Serwist service worker
Tech Stack
- Framework
- Next.js 16 (App Router, standalone output), React 19, React Compiler, TypeScript
- 3D & Charts
- Three.js via React Three Fiber + drei, Recharts, Chart.js, custom SVG isometric projection
- State & Data
- TanStack Query (IndexedDB persister), Zustand, Dexie
- UI
- Tailwind CSS v4, Leaflet maps, CSS print (@page) reports
- Offline
- Serwist PWA with a custom service worker
Technical Deep Dive
013D wellbore trajectory viewerModern wells are rarely vertical. Engineers need to see where the pump sits on the well path, using numbers identical to the hydraulic calculations.+
Survey grid (MD · Inc · Azi) ─► backend (average tangential)
  ─► trajectory (TVD · North · East)
       ├─► 2D charts: MD vs TVD · MD vs Angle · top view · isometric
       └─► WellboreThree (React Three Fiber) ◄─ pump setting depth
└─► toDataURL ─► A4 report attachment- Coordinates: East → +X, TVD → −Y, North → +Z, at 1 unit = 1,000 ft
- Well path built as a CatmullRomCurve3 → TubeGeometry with an emissive material
- Bounding box computed from the data: 6 translucent planes, 12 edges, and a grid on each plane, memoized
- Billboard labels for surface, max TVD, compass points, and PSD, outlined to stay readable over the grid
- Tooltips rendered through drei <Html> into the regular DOM so they can use theme CSS variables
- PSD marker with its own index so its selection never collides with survey stations
- OrbitControls with damping and zoom limits, a GizmoHelper, and fog for depth
02Level of detail from camera distanceWells with hundreds of stations hide the path under dots, so station visibility depends on how close the camera is.+
- In useFrame, the distance from the camera to the bounding-box center drives station scale
- Far away only the tube shows; zooming in grows the stations smoothly until each one is clickable
03Light/dark themes inside WebGLThree.js materials take JavaScript values, not CSS variables, so the scene doesn't follow a theme switch on its own.+
- Twin palettes (PALETTES.light / PALETTES.dark) with 26 tokens: colors, opacities, and light intensities
- Selected from a Zustand theme store: a module-level store is still readable inside <Canvas>, which runs in a separate React reconciler where regular Context doesn't reach
04One capture pipeline for three chart technologiesReports capture the exact same chart components used in the workflow instead of redrawing them.+
- Chart.js and Three.js canvases captured with toDataURL()
- Recharts SVG serialized and rasterized at 3× for 300 dpi print, with computed styles inlined first because an SVG inside <img> can't read page CSS variables
- preserveDrawingBuffer is optional: off in the workflow, on only in the report snapshot modal, so the workflow keeps driver optimizations
- Snapshot canvas ratio derived from A4 page geometry (card size after padding, header, and gap), so the PNG fills the report card with no empty bands
05Five layers of validationEngineering inputs have physical rules (flowing pressure below reservoir pressure, PSD above the perforations, liner below production casing), and results depend on each other across steps.+
Input ─blur─► 1 Client     number format, empty fields
             2 Server     domain rules via per-field upsert
                ├─ error {key, detail} ─► mapped to dotted field path
                └─ success ─► 3 Step status   can_continue → Next button
                               4 Calculations  results marked stale on change
                               5 Cross-step    /impact → equipment cascade
└─► Equipment selection summary- Every field saves on blur or Enter through an upsert endpoint; no giant Save button validating 30 fields at once
- Errors extracted from several response shapes and mapped to dotted paths like perforation.top, so the message appears right under the wrong input
- Per-step error stores in Zustand; editing a field clears its own error, a successful save clears the step
- Technical backend messages normalized into actionable sentences
- A pending-save counter blocks leaving a step before the last blur has saved
- Two-stage confirmation for risky changes, such as a PSD that may cause pump-off; declining restores the value and flags the field
06Calculations that know when they're staleOn Data Inflow, only the input group that changed invalidates its result.+
- Static (Pr / static fluid level) and flowing (Pwf / flowing fluid level / test rate) groups compared separately
- Changed group marked stale and its result hidden until the engineer recalculates
- Switching the IPR model deliberately doesn't invalidate results, since it doesn't change test data
- Composite model selectable only when bubble-point conditions recommend it
- Uncalculated drafts kept in sessionStorage so they survive navigation
07Cross-step impact guardUpstream changes can push the selected pump to fail, and every downstream item is sized from that pump.+
- EquipmentSelectionGuard mounted once on the workflow canvas, active only on the four upstream routes
- Triggered when all mutations on the page settle (useIsMutating), not by hooks in each form, so a new save path can't slip through
- Calls /impact, then fires the cascade endpoint from the right point (pump → intake → protector → motor → cable → MLE) and shows what was released
08Equipment selection summaryOne panel that brings together dozens of results from many endpoints, consistent with the selection tables.+
- Design criteria (rate, TDH, target Q, fluid SG, GVF) grouped with status colors; GVF has its own explained scale
- Shares query keys with the selection forms, so recommendations stay filled after the form unmounts, with no extra requests
- One motor catalog endpoint stores max_motor_load as a side effect; the summary calls it without that parameter so reading never writes
Trade-offs
Assess impact after values are saved
over Predict impact before saving
Predicting would mean running a second PVT → IPR → TDH chain outside the main path; judging what's already stored keeps the message always accurate
One guard triggered by mutations settling
over Impact checks inside each form
The four upstream pages save through different paths (blur, unit dropdown, Calculate); hooking each path risks missing a new one
Backend decides step completeness (can_continue)
over Duplicate completeness rules in the frontend
One source of truth; rules change on the server without the frontend drifting
Trajectory computed by the backend
over Compute MD → TVD in the browser
Numbers on screen are identical to the ones used in hydraulic calculations and reports
Custom SVG isometric projection for the top view
over A second WebGL scene
Lightweight, sharp in print, and easy to annotate
Challenges & Lessons
Three.js scene ignored theme changes
Twin token palettes read from a module-level Zustand store inside <Canvas>
WebGL lives outside CSS; design tokens need a JavaScript twin
Report snapshots of 3D came out black
preserveDrawingBuffer enabled only in the snapshot modal
Turn on expensive rendering flags only where they're needed
Server errors landed far from the field that caused them
Normalize error shapes and map keys to dotted field paths
Validation is only useful when the message appears where the mistake was made
Upstream edits silently invalidated selected equipment
A single settle-triggered guard with a cascading release
Cross-cutting checks belong in one place, triggered by state, not by every code path
Ongoing Improvements
- Extend the offline mutation queue beyond Well Description to the other forms
Next project
Asset Management System